Programming Homework 1: SQL
Gain a hands-on understanding of Google BigQuery and SQL.
Due: February 22, 2024 4:59:59PM
Overview
Welcome to CSEE 4121! This assignment will help you get familiar with the Google BigQuery platform and the SQL language. Google has published many datasets on BigQuery – these range from StackOverflow statistics to real-time air quality data. In this first assignment, you will be using BigQuery’s SQL interface to answer questions about the StackOverflow Dataset.
Learning Outcomes
After completing this programming assignment, students should be able to:
- Write SQL queries on the Google BigQuery platform.
- Use SQL to perform a preliminary analysis of any dataset.
Getting Started
This section will guide you through creating a BigQuery project and setting up your account so that you can query the StackOverflow dataset.
-
Make sure you have followed the instructions provided by CRF to redeem your credits in Google Cloud.
-
Click this link. You’ll see the page below; click “Create Project” to make a GCP (Google Cloud Platform) project.

-
Fill in the information to make a new project. Make sure to select the new billing account you set up after redeeming the class GCP credits.
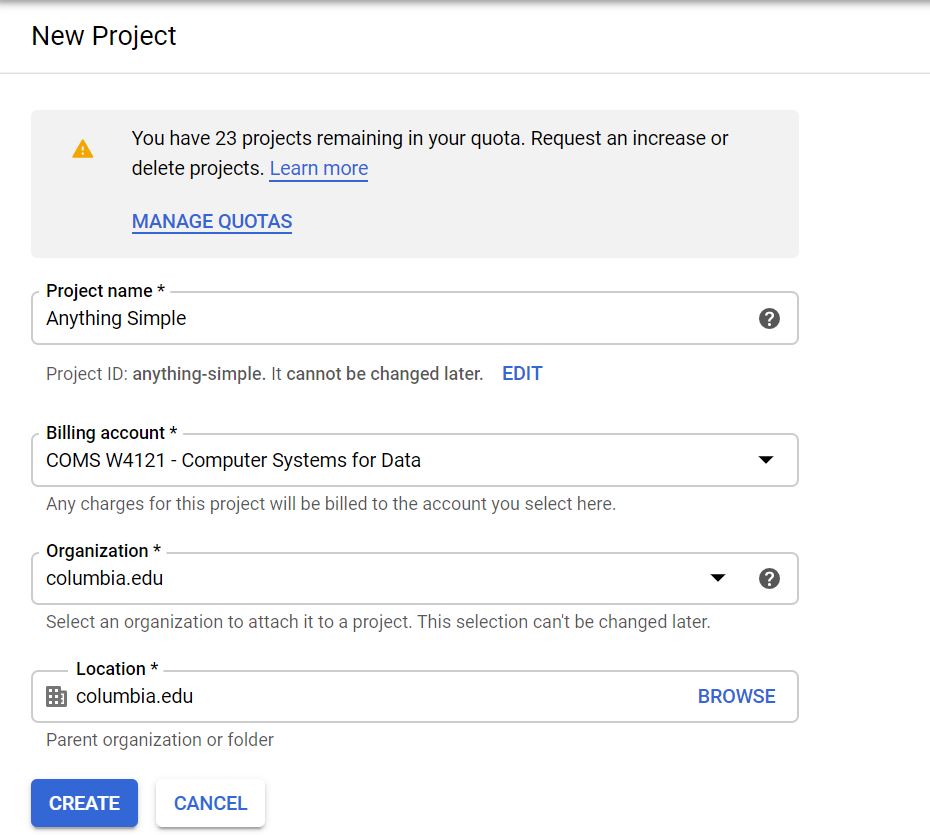
If you mess this up and select the wrong billing account, please follow these instructions to change the billing account for your project to the billing account created in Step 1.
-
Go to this link, which is the page for BigQuery’s public datasets. Make sure to select the correct project in the dropdown menu on the top left.
In the sidebar, you should see a search menu. Search for the
stackoverflowdataset, making sure to click “Expand search to all”, and star it. This will allow you to quickly access it in the future. Make sure to exit the search after doing so. -
Click on and expand the dataset. You should see 16 tables in the sidebar. Click on each table – you should see the schema and descriptions of each table.
Although we will only be dealing with a subset of these tables, it is recommended to familiarize yourself with these tables before you jump into writing queries.
This assignment is intended to test your ability to translate a question in plain English to a schema – in other words, we want you to explore the data and think about which tables and columns are necessary in order to answer the questions. This is how real world data querying and analysis works!
-
Once you’ve selected a table, click on the
QUERYdropdown menu and selectIn new tabto start a query on a table.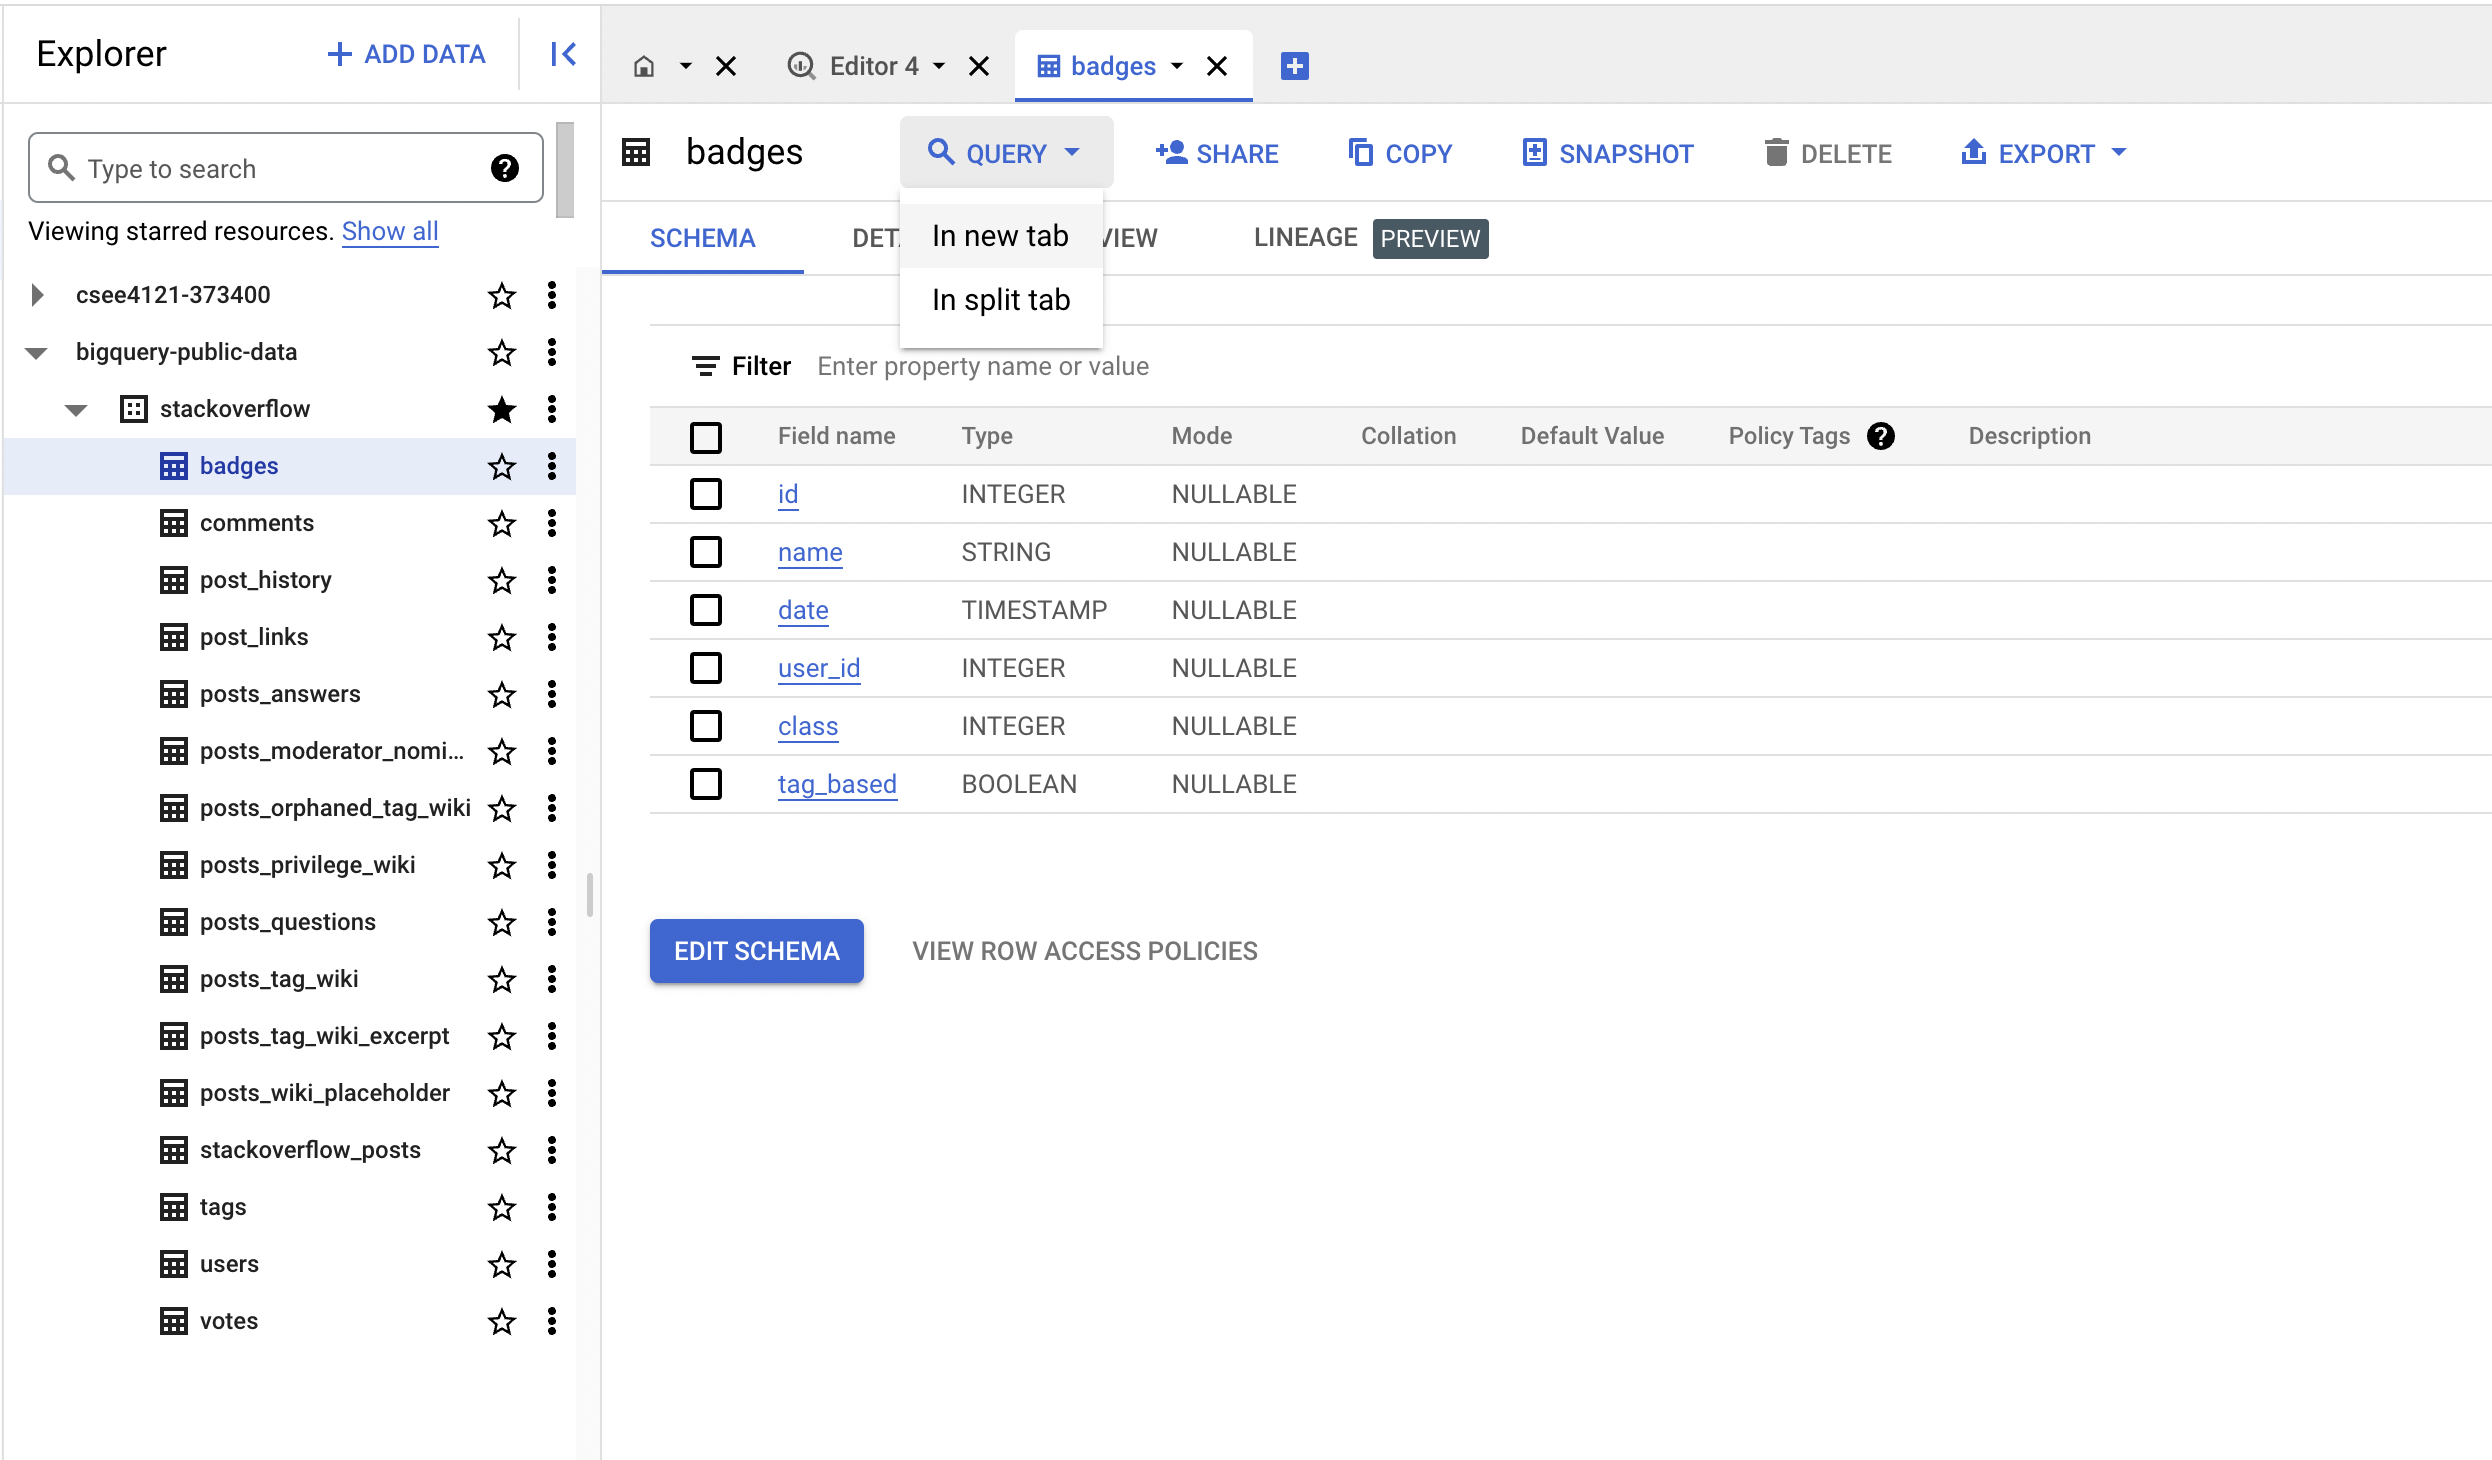
-
Once you type in your query, you should notice that the green validator on the top right corner of the editor. This estimates how much data will be processed when the query is run.
Note: you will be billed by the number of bytes read by each query. Each month, only the first 1TB read is free, so be careful and try to avoid using
SELECT *.
-
In declarative languages, it’s easier to build up the query piece-by-piece. Start with a basic outline of what you’re looking for (for example, write a broad condition, or do a join). Then, add complexity to your query one bit at a time. It’s much easier to debug this way as well.
-
BigQuery can auto-format your SQL queries with Ctrl-Shift-F on Windows or Cmd-Shift-F on macOS (You may need to do some editing for it to take effect). This is a good way to learn about conventional SQL style guidelines and will also make your queries more readable, which we appreciate.
Note: When querying in BigQuery, table names should be wrapped in backticks (`). For example, instead of writing:
SELECT * FROM bigquery-public-data.stackoverflow.userswrite:
SELECT * FROM `bigquery-public-data.stackoverflow.users`
Helpful Resources
- BigQuery SQL syntax
- Using Cloud Console (First section)
Questions
Please read the submission instructions carefully before starting the assignment.
Now that you’ve gotten comfortable with BigQuery and its SQL querying interface, let’s get to work and answer some questions about the StackOverflow dataset!
You will be asked to submit a CSV file containing the results of your queries
for each question. You can download the results of a query using the
SAVE RESULTS button in the Query results panel and choose
CSV (local file). We will provide the column names for the expected output.
Do not edit the file manually after downloading – it may break our autograder.
Notes:
- We will be using an autograder for grading this assignment. Hence, it is critical that you follow the ordering and other constraints as mentioned in the instructions. There is no partial credit for this assignment.
- We will only be working with the following tables:
badges,posts_answers,posts_questionsandusers. You should ignore all other tables that are present in the StackOverflow dataset, and use a subset of the above mentioned tables only to answer the questions below. - In general, the problems don’t state which table you should look at. Instead, it’s up to you to figure that out based on the context.
- CSV output should match exactly in ordering and in values. Make sure to not modify it after downloading from GCP.
-
(1 point) List the top 10 users with the highest reputation with upvotes greater than 20000 and down votes less than 500. Order by highest reputation (i.e., in descending order).
display_name reputation up_votes down_votes -
(1 point) Distribution of users geographically.
List the top 10 locations with the most users, in descending order by count.
location count You might have noticed that there are many
nullvalues in the dataset. Additionally, the location information is not consistently formatted. In the following questions, we will take address these issues. -
(2 points) Distribution of users with respect to countries.
List the top 20 countries with the most users, along with their count. Order them in descending order by count.
Since the location data is messy, we will take the following actions for some of the countries. All strings below are case-sensitive.
If the location contains:
- either “USA” or “United States” as a substring, convert the country name to “USA”.
- either “London” or “United Kingdom” as a substring, convert the country name to “UK”.
- “France” as a substring, convert it to “France”.
- “India” as a substring, convert it to “India”.
- “Bangladesh” as a substring, convert it to “Bangladesh”.
- “Canada” as a substring, convert it to “Canada”.
- “Pakistan” as a substring, convert it to “Pakistan”.
- “Germany” as a substring, convert it to “Germany”.
Omit all
nullvalues of locations in the results. For any other locations, please leave them as-is.NOTE: Only use
SELECTstatements. NoUPDATEstatements are necessary. You should use a series ofCASE ... WHENstatements. No regexes are necessary.country num_users -
(1 point) We now focus on user activity on StackOverflow. List the number of active users every year (since StackOverflow was founded).
Order by years in ascending order.
We consider active users with respect to a year to be users whose
last_access_datewas in that year. It does not matter whether the user was online in previous years or not. For example, if a user’slast_access_datewas in the year 2020, then the user will only be considered an active user for 2020.last_access_year num_users -
(2 points) Some users are dormant, while some are active. We would like to find examples of dormant users. Assume today is January 7, 2023. List the users (
id,display_name,last_access_date) along withdays_since_last_accessanddays_since_creation, which are defined below:days_since_last_access: the number of days between the user’s last access and Jan 7, 2023.days_since_creation: number of days between their account creation and their last access.
List the top 10 users with the above requirements, in order of
days_since_last_access(descending order),days_since_creation(descending order), andid(ascending order).NOTE: Having multiple ordering criteria serves as a tiebreaker mechanism, leading to deterministic output. The ordering criteria are listed in order of priority. That is, results should first be ordered by
days_since_last_access, thendays_since_creation, and finally byid. Make sure to follow this ordering priority!HINT: The
DATE_DIFF()function allows you to compare two dates and extract components from the difference. You may need to cast the given fields, since they are of typeTIMESTAMP.id display_name last_access_date days_since_last_access days_since_creation -
(2 points) How does a user’s reputation change with upvotes and downvotes? Since users’ reputations vary widely, we will bucketize the users into the following reputation buckets: 0-100, 101-1000, 1001-10000, 10001-100000, and >100000.
These are reputation values converted to intervals. Ensure that the above intervals are strings in your final output for the
reputation_bucketcolumn.For every reputation bucket, do the following:
- calculate the upvote ratio (round it to two decimal places) as
upvote_ratio= (total upvotes) / (total downvotes). This is the ratio of the sum of upvotes to the sum of downvotes for the users in that bucket. - calculate the number of users that lie in the bucket as `num_users.
Order by
num_usersin descending order.NOTE: Use the exact reputation bucket values mentioned above. Do not change the interval values.
HINT: Use
CASE… WHENoperators for bucketizing, and theROUNDfunction for rounding the ratio to the appropriate number of decimal places.reputation_bucket upvote_ratio num_users - calculate the upvote ratio (round it to two decimal places) as
-
(2 points) What were the most popular tags in the year 2021 on StackOverflow based on their occurrence? List the top 10 tags along with their count.
Order by
count(descending), and then bytag(ascending).Clarification: You could get the distribution of tags with their counts from the tags table. However, it would be difficult to obtain the count specifically for the year 2021. We suggest using the tags attribute in the
posts_questionstable instead.Note: The year corresponds to the year when the questions were created.
HINT: the
SPLITfunction allows you to split a string based on a delimiter.UNNESTfunction returns a table based on an array as input.tag count You should see that python and javascript were the most popular tags in 2021.
-
(1 point) Badge Analysis: StackOverflow rewards users with various kinds of achievement badges based on different milestones. The badges are divided into three classes: Gold (1), Silver(2) and Bronze(3). More about them here.
Each category of badges has several different badges listed in it.
We would like to find out the gold badges that StackOverflow awards most frequently.
List the top 10 gold badges by name, along with the number of users who have received these badges. Order by the number of users (descending), and then by the name (ascending).
Note: A user can receive more than one gold badge of the same name. We will not do any special handling for this case. That is, if a user has recieved a badge twice, we count that user twice.
name num_users -
(2 points) What is the relationship between a user’s reputation and badges earned?
List the top 10 users along with the number of gold badges they have earned.
Order by the number of gold badges (descending), and then by
id(ascending).id display_name reputation up_votes down_votes num_gold_badges -
(2 points) “Illuminator” is the rarest badge that is awarded by StackOverflow. So far, only 164 users have been awarded this badge.
We would like to find out how early you can obtain this badge. List the top 20 users (
id,display_name,reputation) along with the number of days it took them to receive their first Illuminator badge (since they created their account).Order by the number of days (ascending), and then by
id(ascending).id display_name reputation num_days -
(1 point) Previously, we compared
upvote_ratios between reputation buckets. In this question, we investigate a similar relationship between the score and view counts for questions asked on StackOverflow.Use these score buckets: <0, 0-100, 101-1000, 1001-10000, >10000.
List the average number of views for each score bucket. Round it to 2 decimal places and order it by
avg_num_viewsin ascending order.HINT: Use the ROUND function provided by BigQuery.
score_bucket avg_num_views We can see the high correlation between the scores and the ranges. This seems pretty natural, but it is important to confirm some of our assumptions before conducting further analysis.
-
(1 point) Which weekday had the most answers submitted?
List the day (using numbers 1-7) along with the total number of answers given that day.
Order by the number of answers (descending), and then by
day_num(ascending).HINT: The
DAYOFWEEKfunction allows you to extract the weekday. Its range is 1-7 with 1 corresponding to Sunday. The values of theday_numcolumn should be numerical.day_num num_answers Interestingly, Wednesday has the most answers! It’s not surprising that users do not answer much during weekends.
-
(1 point) What is the percentage of questions that are answered every year?
List the year, number of questions in that year, and the percentage of all questions answered (multiply the fraction by 100 and then round it to 2 decimal places).
A question is said to be answered if the
answer_countfield is greater than zero.Order by the year in ascending order.
Clarification: A question only belongs to the year in which it was created. For example, if a question had a creation year of 2020, then it belongs exclusively to 2020.
HINT: Use the
ROUNDfunction available in BigQuery.year num_questions percentage_answered -
(2 points) List the top 20 users with the most answers along with their
id,display_name,reputation, and the number of answers.Print only users with a number of answers greater than 50. Order them by the number of answers (descending), and by
id(ascending).Clarifications:
- The
answer_countandaccepted_answer_idfields are allnullforposts_answers. idrefers to the id of the answer text.owner_user_idrefers to the user who answered.parent_idrefers to the id of the question corresponding to the answer.
id display_name reputation num_answers - The
-
(2 points) We would now like to find users specializing in Python. A user is considered a Python specialist if they have answered a large number of Python-based questions on StackOverflow.
A Python-based question is a question which contains the substring
"python"as one of its tags.With all the conditions remaining the same from the previous question, print the top 20 Python specialists along with the number of answers they’ve submitted to Python-based questions.
Note: Every answer in
posts_answershas aparent_idattribute pointing to thequestion_id(inposts_questions). Multiple answers can have the sameparent_id.id display_name reputation num_answers -
(2 points) Analyzing posts with extreme scores.
List the average number of answers, favorite count, and comment count for posts with
score < 0andscore > 10000.There should be two rows in the table, with each row corresponding to one of the two score categories.
Round up to 2 decimal places, and order by score.
score avg_answers avg_fav_count avg_comments <0 >10000 Note: Ensure that the output csv has two rows with the score column matching the values in the sample table EXACTLY (string with no spaces).
This is the end of the assignment - great job!
Submission Instructions
This is a solo project. Every student should submit their own work.
File Submission
Each student should submit one zip file to Gradescope.
-
Copy all your queries into
hw1_submission.py. You can find the file on Courseworks. In order to be properly graded, the file must be namedhw1_submission.py. -
Rename your CSV outputs to
qN.csv, whereNis the question number. For example, question 10 would beq10.csv. -
Please ensure that your directory structure is as shown below. The zip file that you submit should have all the csv results as well as
hw1_submission.pyat the root. When you compress your submission, you should select the individual files, rather than the directory containing them.If these files are present in any other folder inside the zip file, then the autograder will fail, yielding no points.
Zip file structure:
UNI_assignment1.zip
├── hw1_submission.py
├── q1.csv
├── q2.csv
├── q3.csv
├── q4.csv
├── q5.csv
├── q6.csv
├── q7.csv
├── q8.csv
├── q9.csv
├── q10.csv
├── q11.csv
├── q12.csv
├── q13.csv
├── q14.csv
├── q15.csv
└── q16.csv
Notes:
When you submit to Gradescope, we will automatically check the following:
- Your SQL query syntax.
- The file structure of your submission (whether all the files follow the naming convention).
- That all files are present.
This should run immediately and return whether the query ran OK or if there were errors - please make sure that you get a positive result from this test in your final submission.
Handling Ties: You may have noticed that in case of ties (between two records of the ordering column), BigQuery may produce either of the orderings. Make sure to follow the tiebreaker criteria specified in each part. You will recieve no credit for incorrect output due to mishandled ties.
You will not see a final grade until after the project deadline. It is your responsibility to ensure that your final submission is free of Python or SQL syntax errors and that you follow all instructions in this section. We reserve the right to deduct points from your project if you do not follow the submission instructions, or if you have syntax errors in your queries.
The autograder automatically checks for cheating. Students that are caught cheating will receive a 0.